This article was updated in May 2024 and cites the most recent global waste statistics and Australian waste statistics.
In this waste statistics round up, you’ll learn:
- How Much Waste Is Produced Globally
- What is Municipal Solid Waste (MSM)?
- Global Waste – Quick Stats
- How Does Waste Management Compare For Countries By Income?
- What Are The Waste Disposal Problems For Local Authorities?
- How Does Waste Affect Our Environment?
- How Much Plastic Is Produced Globally?
- How Much Food Waste Is Produced Globally?
- How Much Waste Does Australia Produce?

How Much Waste Is Produced Globally?
The world generates 2.1 billion tonnes of municipal solid waste annually, this is expected to increase by roughly 80 percent to 3.8 billion metric tons by 2050.

What Is Municipal Solid Waste (MSM)?
Although definitions of MSM vary by country, the term municipal waste refers to waste collected by or on behalf of municipalities.
This category includes households’ household wastes and that generated by:
- Small commercial enterprises
- Offices
- Schools
- Government buildings
- Small companies that dispose of waste at the same facilities as municipally collected waste.
In this article you will also see the term “per capita” which is the same as per person, or per ‘head’.
So, without further ado, here’s a roundup of the most newsworthy and surprising stats about waste.
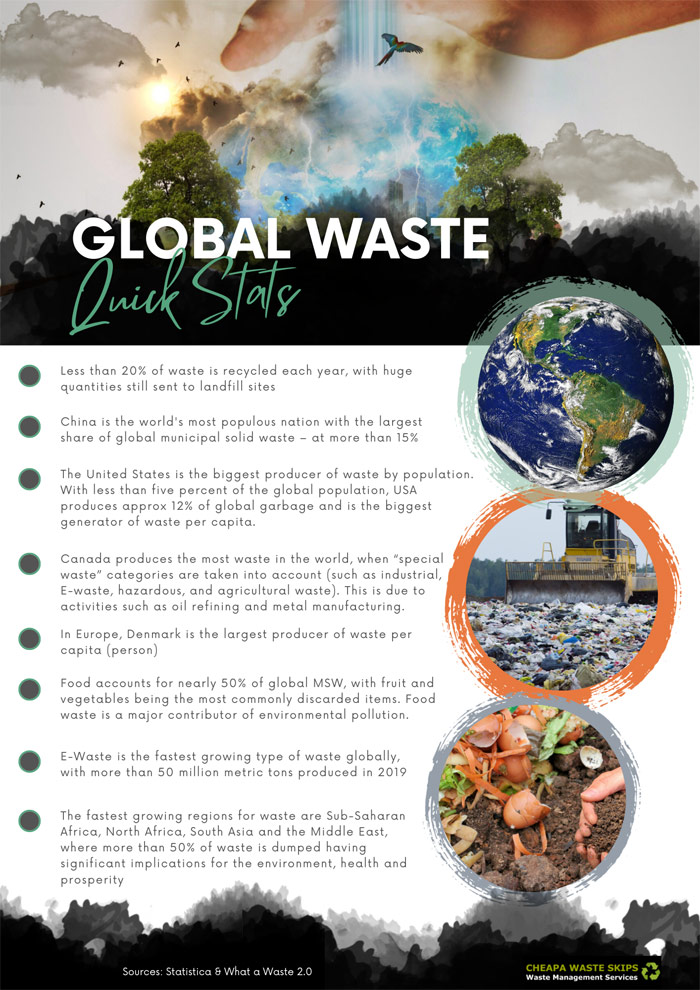
Global Waste - Quick Stats
- Less than 20% of waste is recycled each year, with huge quantities still sent to landfill sites
- China is the world’s most populous nation with the largest share of global municipal solid waste – at more than 15%.
- The United States is the biggest producer of waste by population. With less than five percent of the global population, USA produces approx 12% of global garbage and is the biggest generator of waste per capita.
- Canada produces the most waste in the world, when “special waste” categories are taken into account (such as industrial, E-waste, hazardous, and agricultural waste). This is due to activities such as oil refining and metal manufacturing.
- In Europe, Denmark is the largest producer of waste per capita (person)
- Food accounts for nearly 50% of global MSW, with fruit and vegetables being the most commonly discarded items. Food waste is a major contributor of environmental pollution.
- E-Waste is the fastest growing type of waste globally, with 62 million metric tons produced in 2022
- The fastest growing regions for waste are Sub-Saharan Africa, North Africa, South Asia and the Middle East, where more than 50% of waste is dumped having significant implications for the environment, health and prosperity
Source: What a Waste 2.0
How Does Waste Management Compare For Countries By Income?
- Waste management in urban areas is expensive, on average costing 20% of municipal budgets in low-income countries
- Waste management in middle-income countries accounts for more than 10% of the budget
- Waste management in high-income countries can expect to pay an average of 4% of municipal budgets
- Low-income countries collect around 48% of waste in cities, dropping to 26% in rural areas
- Higher-income regions such as Europe, Central Asia and North America collect 90% or more of the waste
- High-income countries generate around 32% of food waste and generate more dry waste such as plastic, paper, cardboard, metal and glass which makes up around 51% of waste
- Middle-income countries produce more food waste 53% and low-income countries 56%
- In low income countries the amount of waste that could be recycled is just 16%
- Dumping is common practice in lower income countries – totalling around 93%, in comparison to just 2% in high-income countries
- Upper-middle-income countries have the highest Percentage of waste going to landfill – 54%, in comparison to high-income at 39%
What Are The Waste Disposal Problems For Local Authorities?
- Local authorities have competing priorities, such as clean water, utilities, education and health care
- Local authorities usually have limited budgets and this results is less-optimal planning, management and monitoring

How Does Waste Affect Our Environment?
Waste produces greenhouse gas emissions which can trap heat, raise temperatures, and cause air pollution, smog, and respiratory diseases.
- Greenhouse gas emissions are generated from waste treatment and disposal, with approx 1.6 billion tonnes of carbon dioxide generated in 2016
- Solid waste related emissions are set to increase to 2.6
Source: What a Waste 2.0, National Geographic
How Much Plastic Is Produced Globally?
Over 300 million tonnes of plastic are produced globally each year.
- Plastic consumption has increased 4X over the last 30 years
- Global plastics production has doubled from 2000 to 2019 reaching 460 million tonnes. With waste generation doubling over the same period to 353 million tonnes
- Nearly ⅔ of plastic waste comes from plastics with a lifetime of under 5 years, with 40% coming from packaging, 12% from consumer goods and 11% from clothing and textiles
- Only 9% of plastic waste is recycled and 22% is mismanaged
- 15% is collected for recycling but 40% of that is disposed of as residues
- 50% of plastic ends up in landfill, 19% is incinerated and 22% goes into uncontrolled waste sites, is burned or ends up in aquatic environments (particularly in poorer countries)
- 6.1 million tonnes of plastic leaked into aquatic environments and 1.7 million tonnes ended up in the ocean (2019)
- Approx 30 million tonnes of plastic are estimated to be in the seas and oceans, with another 109 million in rivers. The build up in rivers shows that there will be leakage into the oceans for decades to come even if plastics are reduced.
- Only 6% of plastic is produced from recycled or secondary plastic, this has increased from 6.8 in 2000 to 29.1 million tonnes in 2019 globally
Source: OECDn
How Much Food Waste Is Produced Globally?
- Around 931 million tonnes of food waste was generated in 2019
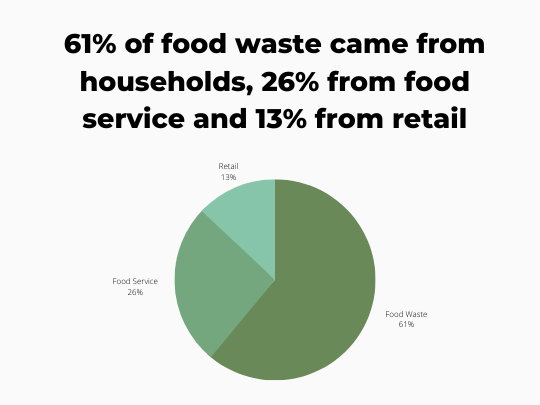
- 61% of food waste came from households, 26% from food service and 13% from retail
- Food waste does not vary significantly based on income level of the country
- Previous estimates of consumer food waste were significantly underestimated and the global availability of food waste data is low
- Food that is not consumed produces 8-10% (estimate) of global greenhouse gas emissions
- 250 square kilometers of freshwater is wasted each year to produce food that is lost or wasted
- 25% of the world’s freshwater is used to grow food that will never be eaten
- Approx 1.4 billion hectares of agricultural land is used to produce food that is lost or wasted (28% of the world’s total agricultural area)
- The UN estimates the direct economic consequences of food waste including fish and seafood is around $1 trillion dollars
- The carbon footprint of food waste is estimated to be 3.3 billion tons of CO2 equivalents released into the atmosphere a year.
How Much Waste Does Australia Produce?
Australia produced 75.8 million tonnes of waste in 2020-21, equivalent to 2.95 tonnes per capita.
- Building and demolition materials accounted for 25.2 million tonnes of the total waste
- Organic waste totalled 14.4 million tonnes
- Ash contributed 12.0 million tonnes to the overall waste
- Hazardous waste, mainly contaminated soil, comprised 7.4 million tonnes, making up 10% of the total waste
- Paper and cardboard waste amounted to 5.8 million tonnes
- Metals waste was 5.7 million tonnes
- Plastics waste was 2.6 million tonnes
- Municipal Solid Waste (MSW) was 14.0 million tonnes, or 545 kg per capita, constituting 18% of the total waste
- Commercial and Industrial (C&I) waste, including ash, totalled 32.8 million tonnes, which is 43% of the total waste
- Construction and Demolition (C&D) waste was 29.0 million tonnes, accounting for 38% of the total waste
- Primary and secondary production waste totalled 758 million tonnes
- Mining waste was estimated at 620 million tonnes, with 96% deposited in tailings dams
- Red mud, a by-product of bauxite refining, amounted to 27 million tonnes
- Coal-seam gas brine totalled 2.4 million tonnes

Source: National Waste Report
Recovered Waste - Key Stats for Australia
This covers waste sent for recycling, used for energy production or exported waste.
- 48% of all recycling waste was masonry materials
- 59% of all exported waste was metals
- Waste categories with the highest recovery rate were: masonry materials (81%), metals (76%) and paper and cardboard (65%)
- The item with the best recovery rate was aluminium (90%)
- Waste categories with the lowest recovery rate were: plastic (19%), textiles, leather and rubber (26%) and hazardous waste (27%)
- Plastic has the worst recovery rate (15%) with 84% going to landfill
Household Waste Statistics Australia
- Households create the most plastic and organic waste
- Households contribute to 55% of all food organics, 70% of all garden organics, 72% of glass and nearly 90% of all textile waste
- Organic waste accounted for over 50% of household waste (6.4 million tonnes)
- E-waste produced by households was around 40% of all e-waste generated, half was recycled. Total of waste produced from e-waste in 2018-19 was 539,000 tonnes
Source: ABS
That’s a wrap for our roundup of global waste and Australian waste statistics. Looking for a particular global waste stat? Please reach out if there is something you are looking for that we haven’t included yet.
For locals, you may like to check out the waste stats for the Sutherland Shire.